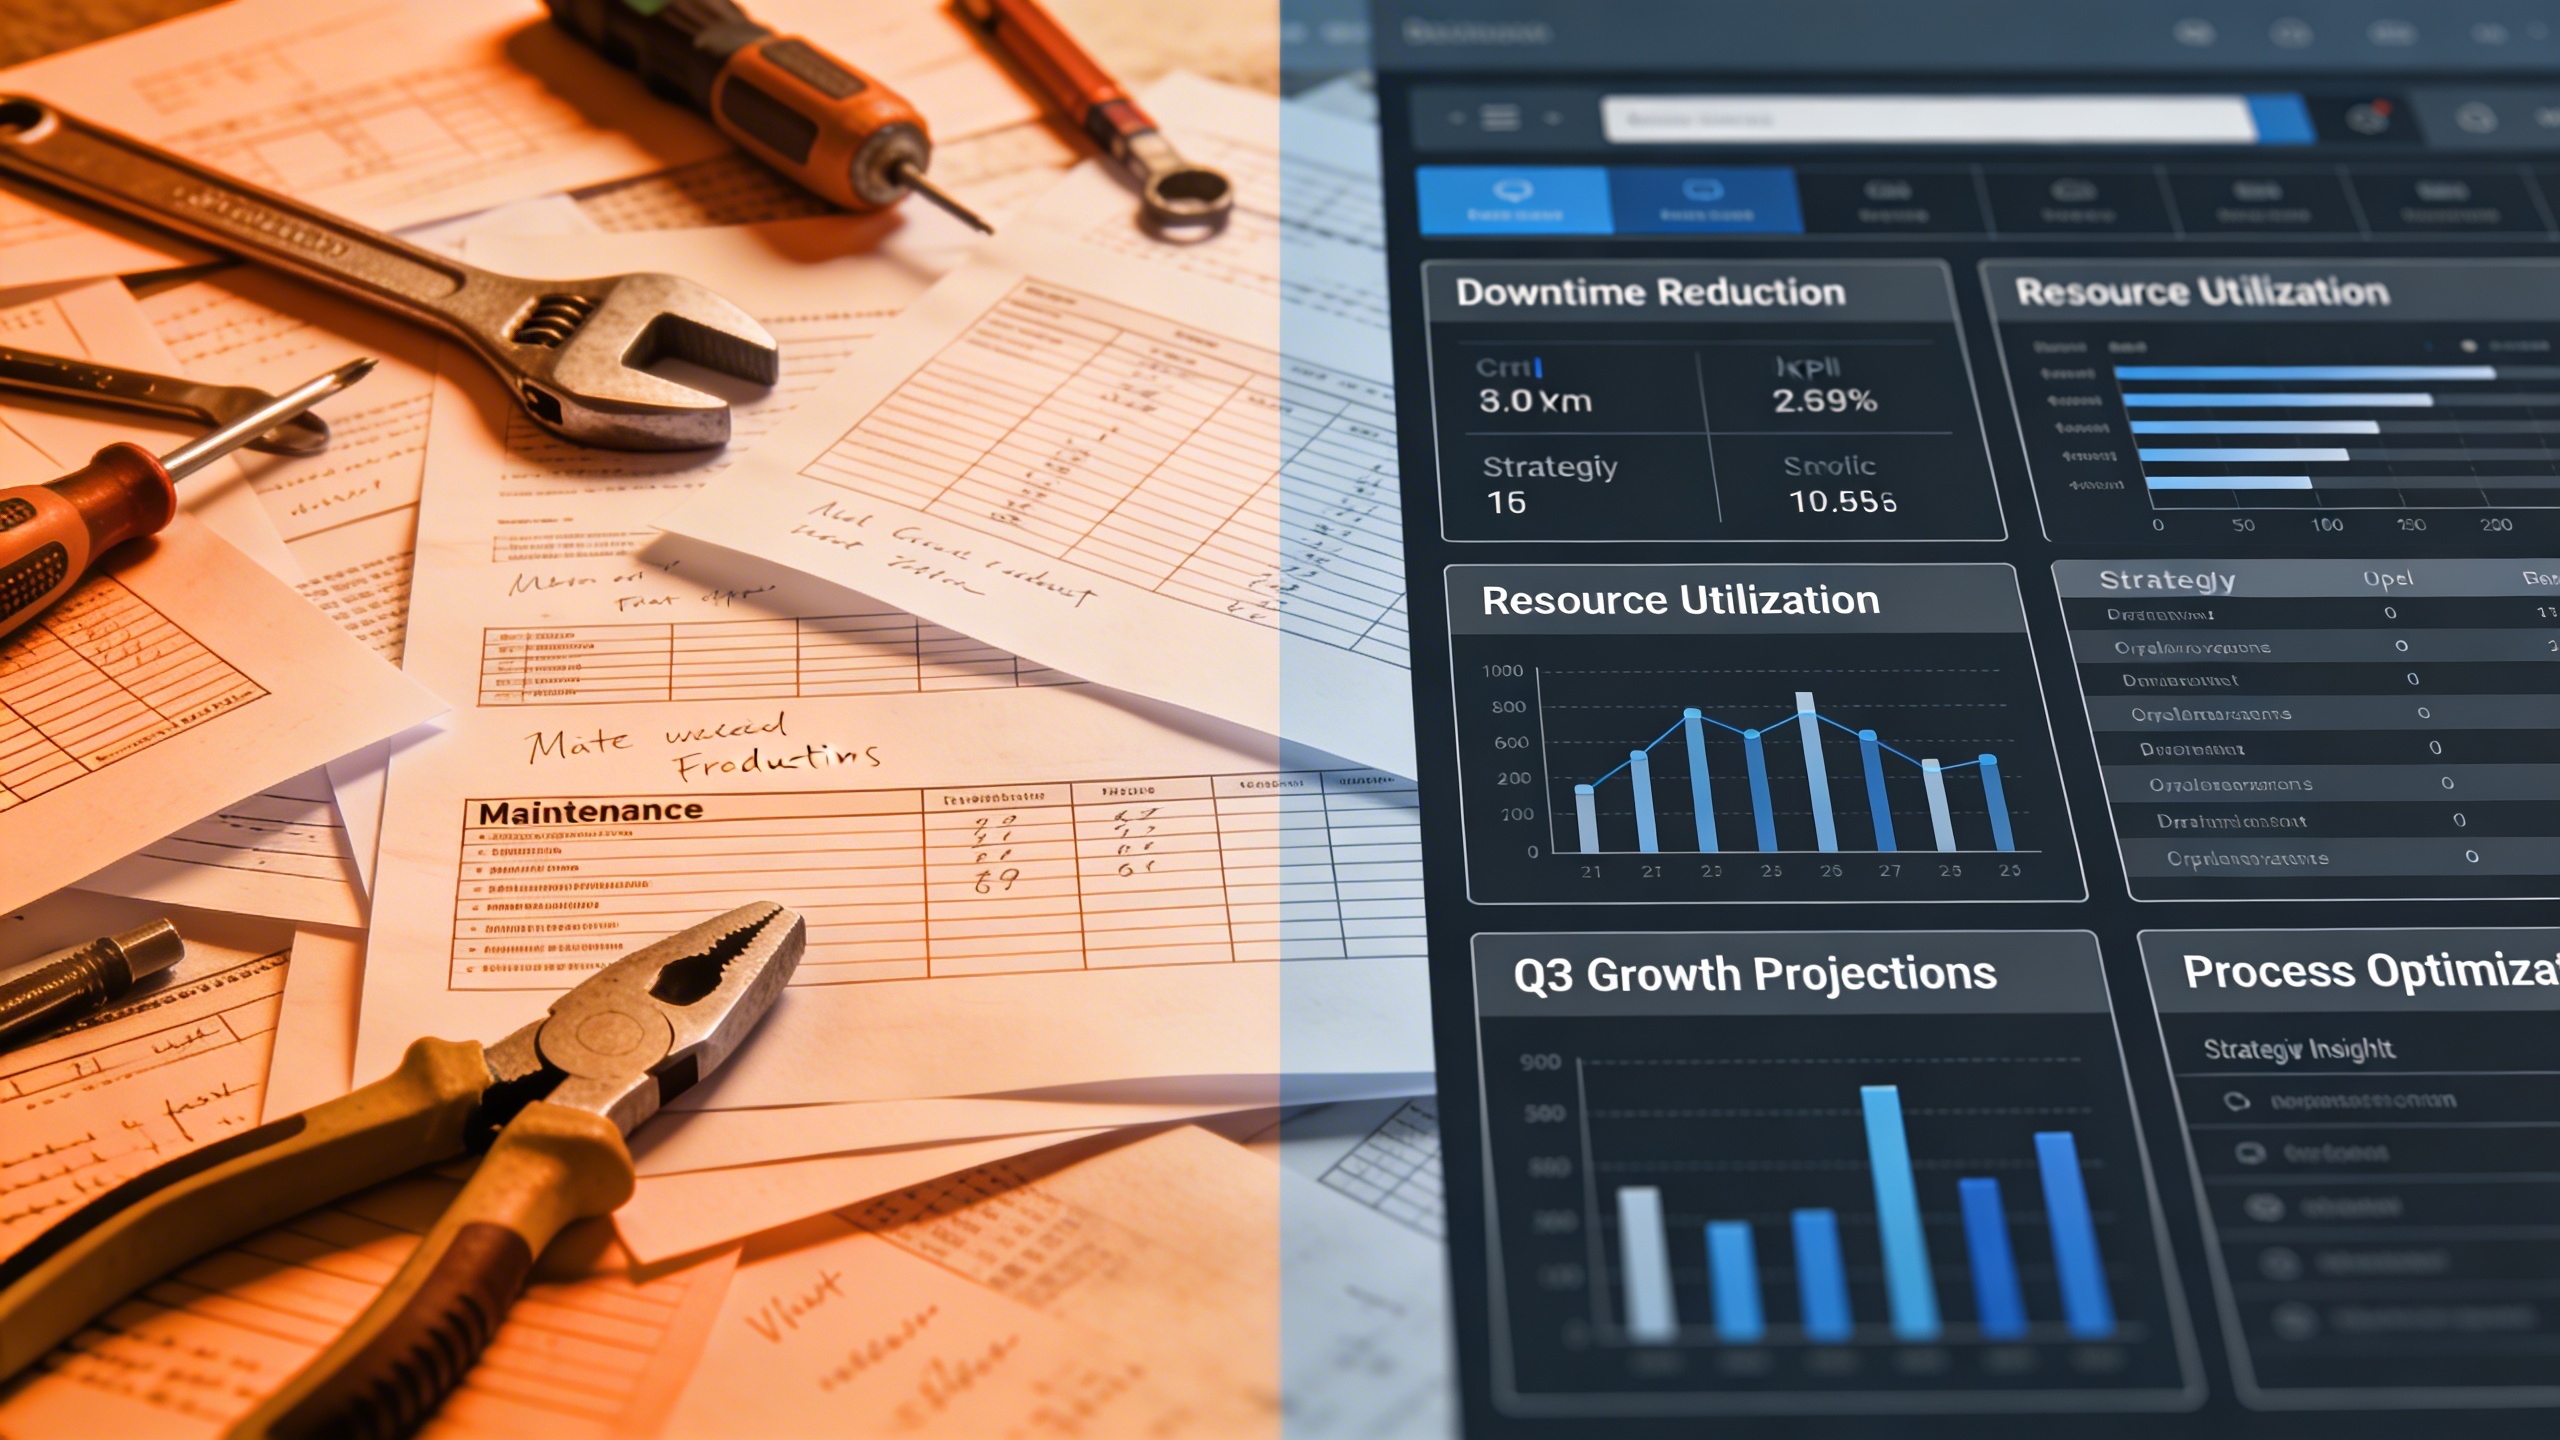
Construction site management, equipment inspection reports, facility maintenance—digital solutions for these “field operations” have been released one after another recently. Examples include the recently announced “Aisea Maintenance” from Idea and the new “Smart Reporting” feature for Sony’s “Patrolog” service. At first glance, these appear to be mere efficiency tools. However, from a management perspective, a closer look reveals the classic pitfall of “management not defining the purpose of IT.”
Many managers tend to view field digitalization (so-called “Field DX”) purely in the context of operational efficiency, such as “digitizing paper” or “speeding up reporting.” Certainly, the resulting time savings and cost reductions are measurable benefits. However, stopping there traps IT investment in the “means becoming the end.” Tools are introduced, and data starts to accumulate. But how is it being used for subsequent “management decisions”? In reality, few organizations can clearly answer this question.
Using the latest Field DX tool news as a starting point, this article presents perspectives for executives, CTOs, and IT managers to redefine “maintenance management” from a mere cost center to a strategic asset. Before selecting tools, let’s consider together: what “objective function” should management define?
What “Field DX” Tools Solve, and What They Hide
First, let’s organize the recent news from a management perspective.
One is the construction management DX solution “Aisea Maintenance” released by Idea Corporation. This is a platform for the end-to-end digital management of maintenance operations (inspections, repairs, cleaning, etc.) at construction sites, covering planning, execution, reporting, and analysis. Field staff report work via smartphone, and managers can monitor progress in real-time. It advocates moving away from paper slips and Excel management.
The other is the “Smart Reporting” feature added to Sony’s facility management service “Patrolog.” This feature uses AI to automatically analyze images taken during inspections, determine the presence of abnormalities, and assist in auto-generating reports. It aids parts previously reliant on human visual checks, aiming to reduce the reporting workload and improve accuracy.
The problems these tools directly solve are clear: “Personalized, inefficient field operations,” “delayed and inconsistent information,” “management limitations of paper or Excel”—they fit perfectly into the context of “work-style reform” or “operational efficiency.” Responsible personnel at implementing companies will likely see tangible results like reduced reporting time and prevention of document loss.
However, we must not stop thinking here. From a management perspective, the crucial question is: “What will we use the freed-up time and data for?” Even if a tool’s dashboard displays numbers and graphs, will it end as mere “operational visualization,” or will it evolve into “management visualization”? This very juncture determines whether IT investment remains a mere cost or becomes a strategic investment.
Has Management Defined the Objective Function for “Maintenance”?
As stated in our editorial policy, when IT is not defined, objectives become fragmented. This is particularly evident in the realm of “maintenance.”
In many organizations, the following stakeholders involved in “maintenance” each have different “objectives”:
- Field Staff: To complete assigned inspections without omission and as quickly as possible (Objective: Task Completion).
- Field Supervisors / Managers: To prevent trouble within their area of responsibility and avoid complaints (Objective: Problem Avoidance).
- IT Dept. / Implementation Team: To get everyone to use the introduced tool and achieve 100% data entry rate (Objective: Tool Adoption).
- Accounting Dept.: To keep maintenance-related costs within budget (Objective: Cost Control).
And often, only the management layer lacks a clear objective function for “maintenance.” Budgets are allocated for passive, defensive reasons like “because the law requires it” or “because trouble would be problematic,” resulting in the disparate optimization of each layer’s objectives mentioned above.
So, what is the “objective function for maintenance” that management should define? It begins by posing questions linked to the sustainable growth of the business and the maximization of asset value, such as:
- How do our “facilities and equipment” contribute as assets to customer experience and brand value? (e.g., A clean and safe store affects repeat rates)
- What business outcomes (increased sales, improved customer satisfaction, new business creation) can be achieved by raising (or optimizing) the standard of “maintenance”?
- Can we analyze collected inspection data for equipment aging patterns or failure precursors to optimize the lifecycle cost of the entire asset portfolio?
For example, in retail, “store cleanliness and lighting brightness” might correlate with customer dwell time and purchase amount. With that hypothesis, cleaning inspection and lighting equipment data transforms from mere “work records” into “customer experience metrics affecting sales.” In a factory, performing predictive maintenance from equipment vibration data to prevent unplanned downtime and associated opportunity loss directly links to securing revenue.
In this way, only when management redefines “maintenance” as “strategic asset management” does the meaning of data collected on-site and the investment value of IT tools fundamentally change.
The “Data → Insight → Action” Cycle to Design Before Tool Implementation
Once management objectives are defined, the next step is designing the “data flow” to achieve them. A common failure here is starting data collection with a “tool-first” approach, only to later wonder, “What can we do with this data?”
Excellent tools like “Aisea Maintenance” or “Patrolog” dramatically improve the “entry point” for data collection. However, if the subsequent process—“how to analyze the data (insight), who makes what decisions (decision-making), and how it reflects in field actions (behavioral change)”—is not designed in advance, it becomes a wasted opportunity.
The specific design steps are as follows:
1. Identifying Decision Points
Clarify who should make what decisions, and how often, based on the collected maintenance data.
- Field Level: Create response schedules based on priority for equipment flagged “requires inspection” by AI.
- Management Level: Compare equipment failure rates by region or store to review maintenance systems or budget allocation.
- Executive Level: Use company-wide equipment aging data and renewal cost forecasts as a basis for mid-to-long-term capital investment plans (CAPEX).
2. Designing Reporting
Design dashboards or periodic reports that extract only the information needed for each decision-making level. For executives, KPIs directly linked to business outcomes are essential, such as “correlation graphs between overall hygiene scores and customer ratings across all stores” or “estimated production increase from reduced downtime via predictive maintenance.” Graphs of field task completion rates might be unnecessary here.
3. Closing the Loop to Action
Ensure a route where decisions stemming from insights reliably translate into field actions or budget allocations. For example, a mechanism where a “raised hygiene standard” decided in an executive meeting is automatically (or reliably) incorporated into revised inspection checklists within the tool and into training programs for field staff.
By designing this entire cycle as the goal of “Maintenance DX,” tool implementation finally transcends the framework of “operational efficiency” and begins to function as the “nervous system supporting management decision-making.”
Concrete First Steps for Executives, CTOs, and IT Managers
Finally, we propose concrete actions to take the lead, rather than just being swept along by the wave of Field DX.
Recommendation for Executives: The next time a “field digitalization” proposal comes up, always ask: “Which of our strategic goals will this data measure, and how will it improve our decision-making?” You could even require the submission of a “Data Utilization Cycle Design Document” as a condition for budget approval. Return to the fundamental principle that IT investment is an investment to enhance the quality of management judgment.
Recommendation for CTOs / IT Managers: Before getting swayed by tool vendor sales pitches, gather all departments involved in your company’s “maintenance” operations (field, facilities management, accounting, business units) to hear their current challenges and respective “objectives.” Then, engage in dialogue with the executive layer and play the role of jointly defining the “objective function for maintenance” in light of business strategy. You are not merely the point of contact for tool implementation, but the “strategic translators” connecting management and the field.
Question for All Readers: In your organization, is “maintenance” a cost, or a strategic asset? The answer to that will determine the true value of any Field DX tool you are about to introduce (or have already introduced).
Digitalization is not the goal; it is a means to execute management’s will. The task of giving meaning, through the “lines” and “planes” of management, to the myriad “dots” of data scattered across the field. That is precisely the first step, starting today, that executives must face head-on, not evade, regarding IT.


Comments